Data Visualization Resources

Infographics, maps and other data visualizations have quickly become one of the best ways of getting stories across quickly, and with impact. Developing these on your own can be intimidating, and we can help you with your data visualization needs, but there are a lot of tools out there to help you tell your story with visuals.

What is Data Visualization?

  • The presentation of data in a graphical or pictorial format. It allows decision makers to see analytics presented visually, so they can grasp difficult concepts or identify new patterns in their data.
  • A way to communicate your organization’s impact in a visual format. Rather than spreadsheets, with columns of numbers or extensive written content, data visualization takes the form of charts, graphs, or even maps. Data visualization is often a very effective way to consolidate large amounts of data or abstract concepts and translate them into something more concrete.

Why Data Visualization?

Comprehend Information Quickly
By using graphical representations of business information, businesses are able to see large amounts of data in clear, cohesive ways – and draw conclusions from that information. And since it’s significantly faster to analyze information in graphical format (as opposed to analyzing information in spreadsheets), businesses can address problems or answer questions in a more timely manner.

Identify Relationships and Patterns
Even extensive amounts of complicated data start to make sense when presented graphically; businesses can recognize parameters that are highly correlated. Some of the correlations will be obvious, but others won’t. Identifying those relationships helps organizations focus on areas most likely to influence their most important goals.

Communicate the Story to Others
Once a business has uncovered new insights from visual analytics, the next step is to communicate those insights to others. Using charts, graphs or other visually impactful representations of data is important in this step because it’s engaging and gets the message across quickly.

Why is Data Visualization important?

For many people, numbers alone just  aren’t enough to communicate your organization’s impact effectively, no matter how impressive those numbers might be. Sifting through raw data is tough and time-consuming, and not everyone will draw the same conclusions from that unfiltered data. Visualized data, on the other hand, is easy to read and share, and is therefore one of the most effective ways to communicate your outcomes. This makes visualized data a great way to provide the public with proof positive that your organization is achieving its mission. Think about it this way: if you were a potential donor, would you rather read spreadsheets of data or a comprehensive infographic?

What makes a good data visualization tool?

Good data visualization tools help you prove your impacts clearly and accurately. The results will look professional, and will communicate trends and stories, not just end results. A one-size-fits-all tool can be useful if it allows you to utilize the right statistics. However, a customizable tool that is already integrated with your data collection methods has significant advantages when it comes to accuracy and efficiency. When your data visualization is directly connected to your outcomes reporting, you can incorporate long-term goals, demographics, when demonstrating an overall impact. Other attributes of a good data visualization tool might include a user-friendly interface, customizable filtering options, and data grouping layer options.

Preparing your organization for data visualization technology requires that you first:

  • Understand the data you’re trying to visualize, including its size and function.
  • Determine what you’re trying to visualize and what you want to communicate.
  • Know your audience and understand how it processes visual information.
  • Use visuals that convey the information in the simplest form for your audience.

Data Visualization Tools for Non-Profits

Canva Logo

Canva (an Capacity Collective favorite!) is an easy-to-use and online tool that can be used for a variety of data visualization projects. It features an infographic maker, with hundreds of free templates, fonts, images, etc. Premiumfeatures can be purchased for $1.00 each, but we find the free tools more than enough!

Canva has a dedicated infographic maker that is free to all users. It also is great for organizations with social media platforms, or those organizations looking to enhance their branding and marketing. Canva has templates for Facebook and Instagram, as well as templates for posters, postcards, event invitations, and much, much more. Check it out here.

Free for Basic or $12.95/month for Premium

Visme Logo-1

Visme promises to help you ‘speak visually’. You can also use it to build presentations, but it’s especially geared towards creating engaging infographics. This free tool includes over 100 free fonts, millions of free images and thousands of quality icons, and there are options to include video and audio (including the ability to record a voiceover directly in the editor, which is handy). You can also animate your content to make things clearer.

Free for Basic or $13/month for Standard

Cacoo Logo

Cacoo is a cloud-based infographic maker, and as with any cloud-based tool its major plus point is collaborative working. Cacoo’s interface allows teams to create, edit, and deliver high-quality diagrams together online, in real time. The application offers a diverse library of templates and shapes to help you put together beautiful visuals quickly and easily, with everything you need to create flowcharts, wireframes, network diagrams, org charts, and more available through the user interface.

You can also share your infographics with team members and clients if they don’t have a Cacoo account, and integrate Cacoo with other productivity tools such as Google Drive, Adobe Creative Cloud, and Confluence.

$4.95/month for Personal or $15/month for Team

Piktochart Logo

Piktochart is an infographic and presentation tool that enables you to turn boring data into engaging infographics with just a few clicks. Piktochart’s custom editor lets you do things like modify colour schemes and fonts, insert pre-loaded graphics and upload basic shapes and images. Its grid-lined templates also make it easy to align graphical elements and resize images proportionally.

Free for Basic or $12.50/month for Lite

Snappa-Logo.png

Snappa is a graphic design tool that includes a free infographic maker. This one is aimed at non-designers. You won’t have the kind of control on offer with some of the other tools on this list, but it does promise you will be able to ‘whip up’ an infographic in 10 minutes or so. Snappa offers preset templates that are optimised for social sharing on the web. There’s a simple drag-and-drop interface, and access to thousands of hi-res, royalty free stock photos.

The free plan gives you five downloads per month and two social accounts, or you can upgrade for features such as unlimited downloads.

Free for Basic, $10/month for Pro, or $20/month for Team

More Data Visualization Tools

Word clouds are another creative way to present your (qualitative) data. A word cloud is an image composed of words used in a particular text or subject, in which the size of each word indicates its frequency or importance.

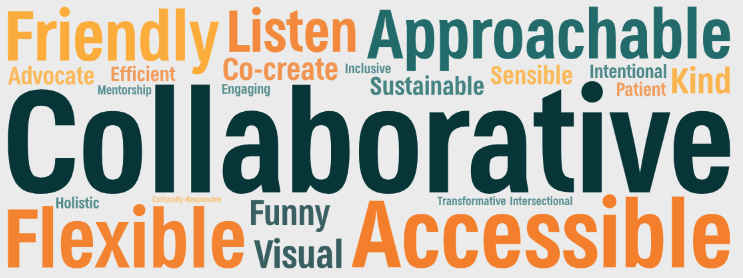
The word cloud above was made with Word Art, a free online word cloud generator that allows you to customize the following information:

  • Words/Content (Import Function)
  • Word Cloud Shapes
  • Fonts
  • Layout (Vertical, Horizontal, etc.)
  • Style/Color

Content Borrowed From: Social Solutions, SAS, and Creative Bloq.

Photo Credit: Fusion Brew